Debugging mobile apps can be tricky. Especially when debugging production apps. One of our team's most powerful tools is Charles Proxy. It is used by QA, Developers and even by other non R&D teams.
Here I will demonstrate some super easy and super powerful techniques used to debug/monitor our mobile app. (By the way - most of the stuff here are true for regular desktop/mobile web apps as well)
Connect your mobile device to your Mac/PC
So - lets get started. First you will have to connect your device to your PC/Mac. This is SUPER easy when using Charles (both mobile device and computer should be on the same network):
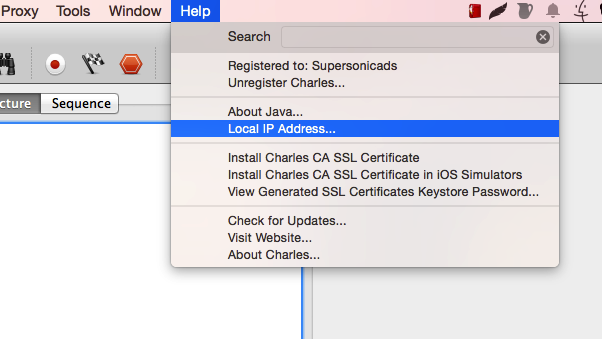
- Check your network's local IP address. The simplest way is using Charles' help menu:
Connect your mobile device to this address:
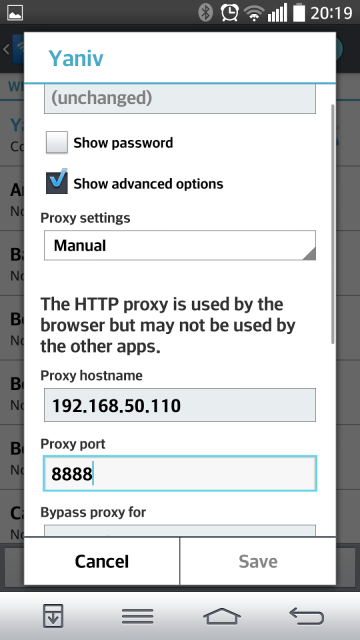
2.1. Android (OS 4.X and above. For Android 2.X look here) Go to settings->network->wifi and long press your selected network. Then choose the following settings (the IP is the IP you located in previous section)
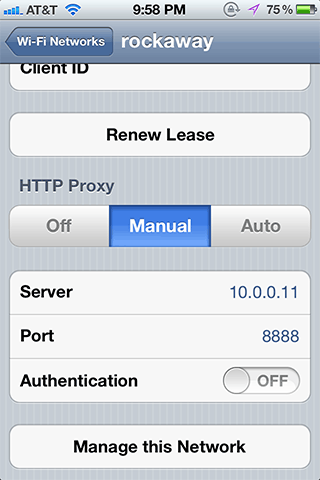
2.2. iOS Go to wifi settings and choose your internal network
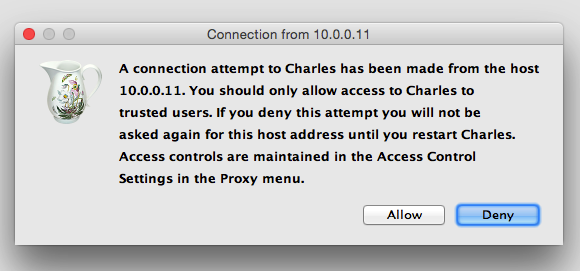
Charles will ask for your approval (only first time you connect your device):
And... That's it. You are connected and are ready to get started!
Monitor mobile traffic
The first thing to do is monitor your mobile app's traffic. Lets choose IMDB as a "victim" app and monitor its traffic. I'll choose "record" button and open IMDB. This is what we'll see:
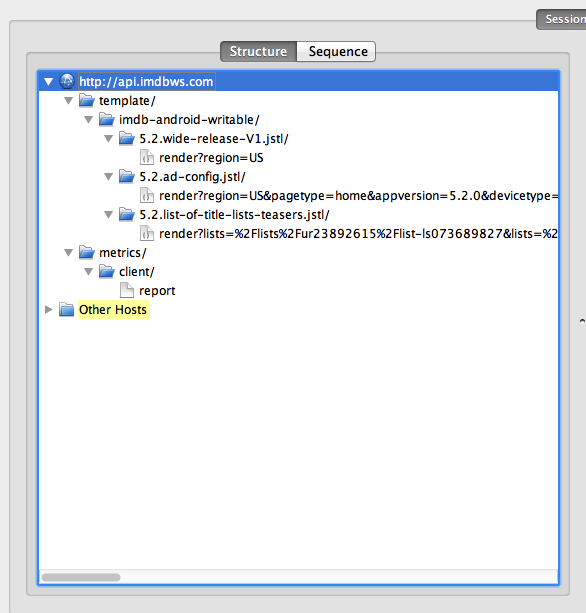
What we sees here is filter I created with imdbws.com as a domain. You can set focussed domains on "view->FocussedHosts". From here we can monitor all request/response data, including timing charts!
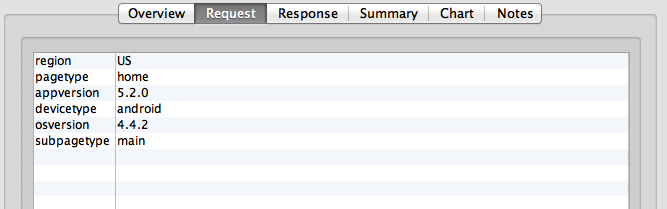
Request data
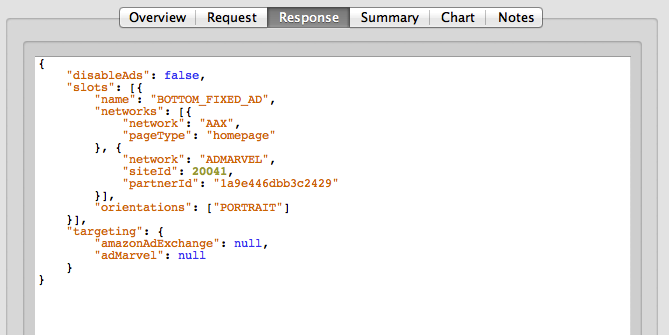
Response Data
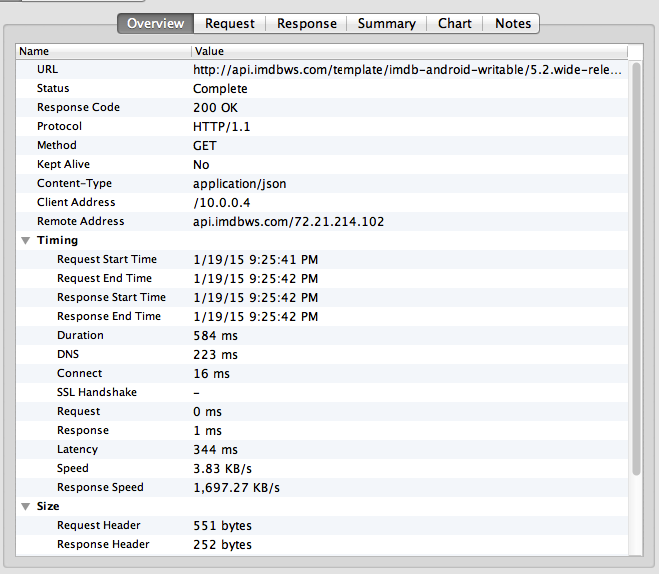
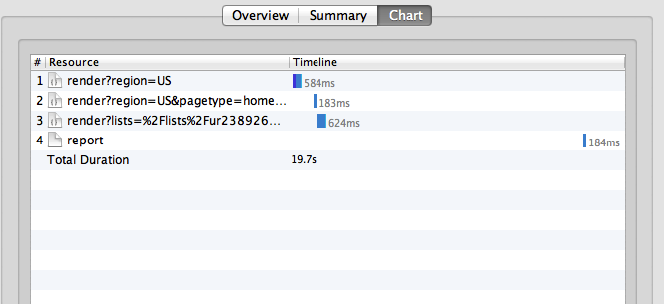
Time Charts
In the next part of this post I will show some advanced, super powerful use cases, like setting Rewrite rules (for changing request response on the fly), Throttling (for testing different network speeds), Using VPN, routing the traffic to staging servers and more...